A few weeks ago, I participated in TreeHacks 2026 with my friend Terry. And while I usually focus on other types of hacking (and honestly don’t know why people use the word “hacking” for… just building a project?), I really enjoyed the event, because in addition to the typical hackathon events (roughly “create a project in a weekend”) there were all sorts of cool talks, activities, and people to meet! It was a really fun weekend, and I will definitely be coming back next year.
the project
During the hackathon, we built gallop, a proof-of-concept multi-agentic framework for cyber defense. It integrates with existing EDR solutions that send logs to an Elasticsearch instance, and runs an agent that scans these logs in real time for anomalies and malicious activity. In this blogpost, I hope to go over how it works, at a technical level.
motivation: stop breaches as they happen
When coming up with ideas on what to build, we decided to build something security-related (because that’s what I have background in). Taking inspiration from ARTEMIS, a multi-agentic autonomous penetration testing framework created as part of a research project I’m a part of, we thought, could we make an autonomous agent for the opposite task–defending systems from attacks? In an ideal world, this agent would be able to see a cyberattack as it is happening, and perform steps to stop it from happening before an attacker can penetrate the network.
I’ve played around with this idea a lot, and so have many others in the field. In fact, last year, Anthropic published a blog post about using Claude in cybersecurity competitions, one of which was WRCCDC, a cyber defense competition where collegiate teams are tasked with active defense of a corporate network from cyberattacks. Their agent was given shell access to the machines on the WRCCDC network, and they performed hardening steps, and searched for indicators of compromise to patch systems and ensure service uptime.
However, as an active competitor in cyber defense competitions, I had doubts about this approach. Claude didn’t do very well during WRCCDC, and I suspected that one of the reasons why was the mere scale of the data that must be taken in to have full visibility of what is happening in a system. However, when humans get visibility on a network, they usually use log aggregation and SIEM tools like Wazuh or Splunk. These tools put all the relevant data in one place, and let you to define rules that filter out normal data to search for abnormalities. In the past, one log aggregation framework that I have used is the ELK stack (Elasticsearch, Logstash, Kibana). Even better, there are already tons of tools for ingesting data into an ELK stack (like Beats).
So, we decided to give an agent access to an ELK stack through Elastic Cloud’s AI Agent Builder, giving it tools to efficiently take in events happening on managed devices, without having to take in all the logs into its context. This also allows us to trigger an AI agent when suspicious activity occurs based on pre-defined rules.
project structure
We decided on an orchestrator-subagent architecture, with an orchestrator agent running in Elastic Cloud, and subagents running on each managed machine:
                        +------------------------------+
                        |  Orchestrator agent          |
                        |  (running in Elastic Cloud)  |
                        |                              |
                        |  Called on:                  |
                        |      - 30 second intervals   |
                        |      - suspicious activity   |
                        +------------------------------+
                                        |
                                        |
                              +------------------+
                              |  dispatcher      |
                              |  (connected to   |
                              |  all subagents)  |
                          /---+------------------+----\
                  /-------              |              -------\
 +------------------------++------------|-----------++------------------------+
 |        subagent        ||        subagent        ||        subagent        |
 |+----------------------+||+----------------------+||+----------------------+|
 ||  Log ingester stub   ||||  Log ingester stub   ||||  Log ingester stub   ||
 ||       (eBPF)         ||||       (eBPF)         ||||       (eBPF)         ||
 |+----------------------+||+----------------------+||+----------------------+|
 |+----------------------+||+----------------------+||+----------------------+|
 ||   Agentic executor   ||||   Agentic executor   ||||   Agentic executor   ||
 ||     (OpenAI API)     ||||     (OpenAI API)     ||||     (OpenAI API)     ||
 |+----------------------+||+----------------------+||+----------------------+|
 +------------------------++------------------------++------------------------+
The orchestrator agent runs Elasticsearch queries on the ELK stack, and is triggered every 30 seconds on the past 30 seconds of data. It can also be called based on predefined rules, to trigger incident response and triage when suspicious activity takes place. The extensibility of Elasticsearch gives us flexibility in what calls our agent, making it also easy to integrate into an existing SIEM solution.
The orchestrator calls a dispatcher program when it comes up with actionable steps for vulnerability or attack remediation, and sends instructions to the subagents, which execute the remediation actions.
data collection
For our proof-of-concept runs, we implemented one data ingest pipeline bundled with our subagents. When an attacker performs malicious actions on a device, often this happens through shell commands run on a computer. So, we thought it would be effective to keep track of exactly what commands are running on a computer at any time.
However, this is a slight technical challenge–many tools for this purpose (like pspy) rely on polling the Linux /proc/ filesystem in a loop, which is slow and prone to missing commands (especially if they run for very short amounts of time). To effectively catch all the programs run, we need something that can call our code exactly when a command is run. This will allow us to be notified when a command runs, without the chance for commands to be missed during a polling loop.
The first technology I thought about was inotify, which is a Linux kernel subsystem that lets users define hooks on files, which get called when a file is accessed. This can be applied to the /proc/ filesystem, triggering our code whenever a process is spawned. However, when we tried this, we found that in the time between our code getting triggered and our code reading process metadata from /proc/, short-running processes would exit, stopping us from getting the process information.
So, we tried a different technology, eBPF. eBPF is a Linux kernel feature that lets us run code in a virtual machine running in kernel-space. This gives us low-level access to process spawns, allowing us to directly grab information about processes as they spawn. In our implementation, we ended up taking inspiration from execsnoop.bt, a tool that uses bpftrace.
With that, we were able to have a handler that sent commands to Elasticsearch as they happen! Combined with other data sources like Filebeat, we can use this to get a comprehensive view of what is happening on a system.
agentic defense execution
The second component of the subagents is a command execution pipeline that enables active defense. We considered just having the orchestrator send a command to the subagents, which directly execute commands. However, many remediation steps are complex, and require multiple layers of data collection, and understanding of the environment context. Because of this, we made the subagents run an agentic loop using OpenAI models. The orchestrator sends subagents a natural language prompt that includes information about suspicious activity, and actionable steps to remediate the activity. Then, the subagents can run commands in a feedback loop, letting them to carry out remediation steps in the context of the local machine. This allows for more effective defense, and for multiple retries in the case that remediation fails.
While building, we had a lot of concerns about validation and ensuring that an agent does not perform actions that break critical computer functionality. In a future iteration of Gallop, we would likely implement a validation subsystem on top of this agentic execution system, in order to double-check actions taken to ensure that they do not cause service downtime or destroy important data.
frontend
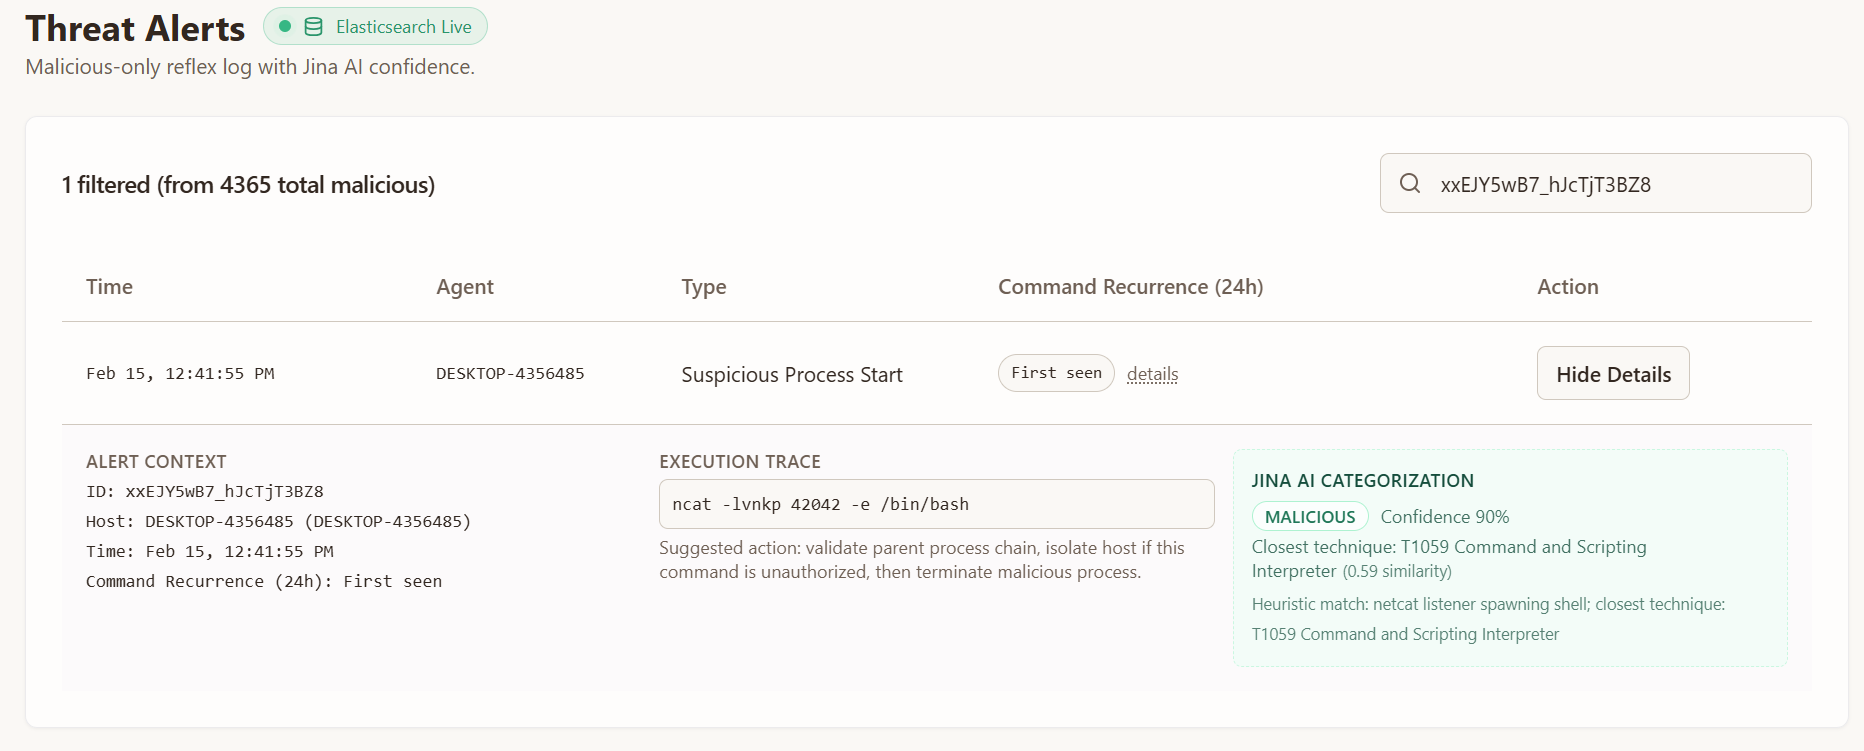
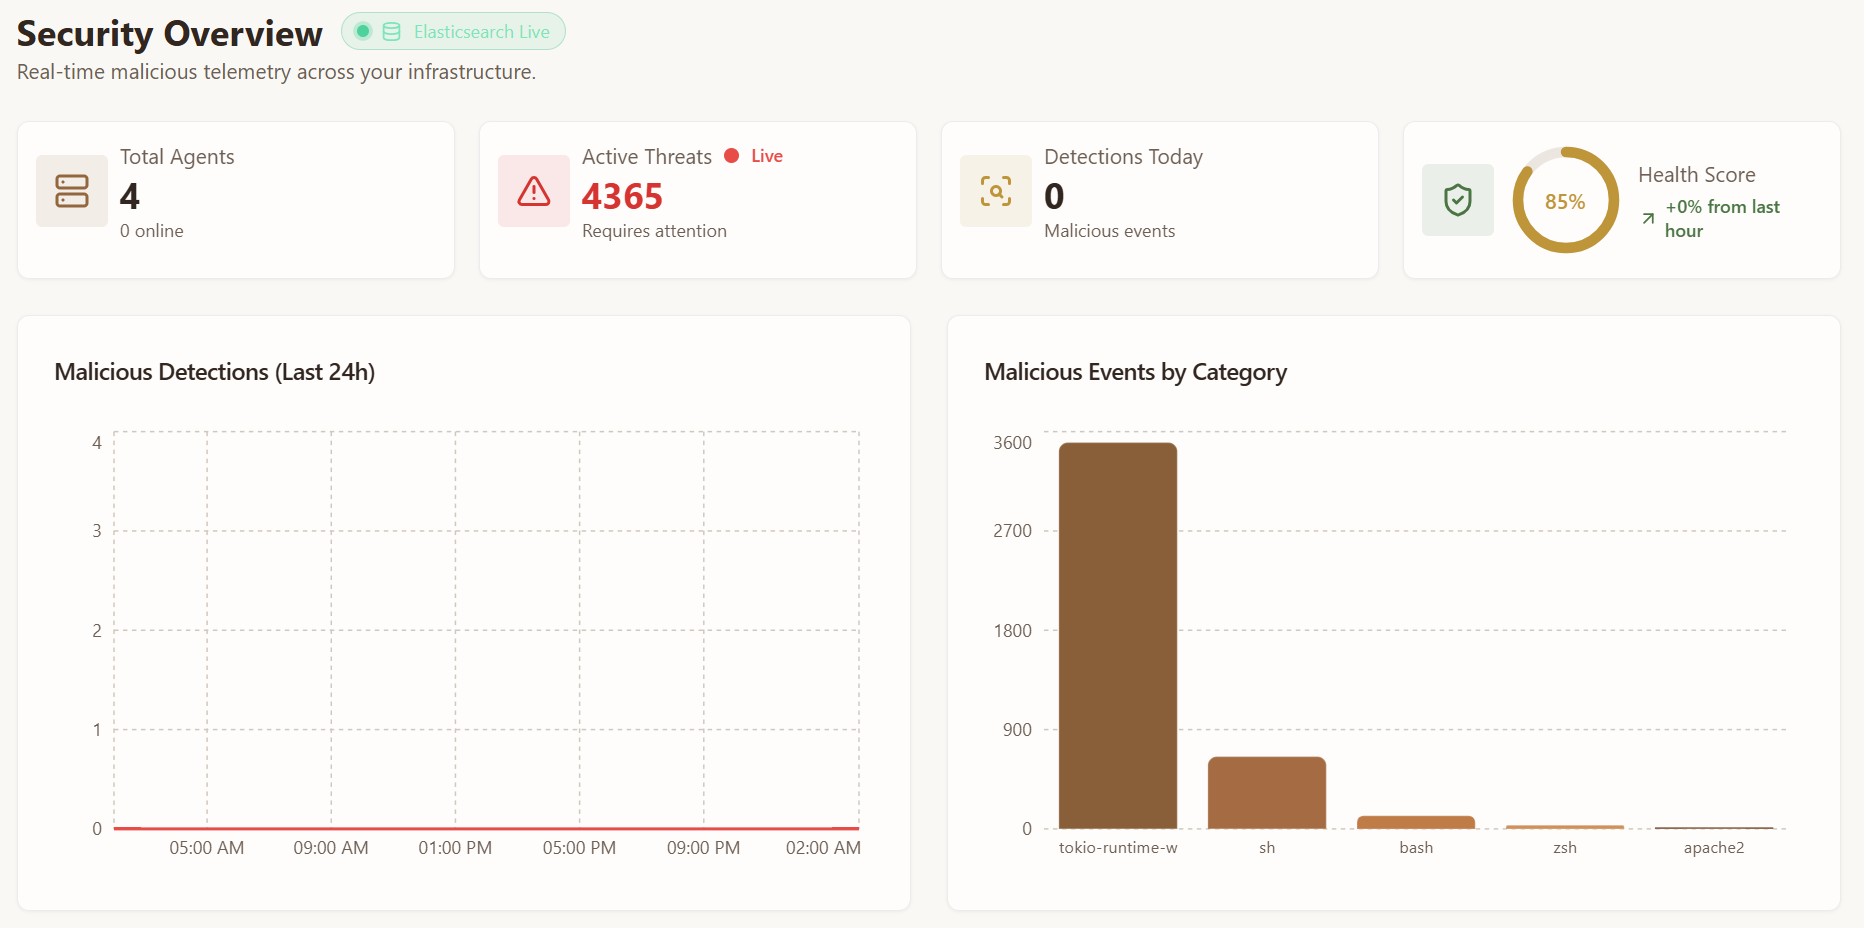
Terry built a really cool UI that pulls data from Elasticsearch and shows suspicious activity as it happens! This allows network administrators to find all suspicious activities and remediations on a network in one place, in real time.
limitations and disclaimers
Gallop is, and likely will stay, a hackathon project. It’s really a proof-of-concept for future agentic frameworks, and is in no state to be used on any real computer. There are a bunch of (really important!) things that are not yet implemented, like multi-tenant management, and the overall setup on the website. There’s even a RCE vulnerability that we didn’t catch while building (I wrote a proof-of-concept exploit while waiting for judges to visit our project…)! If I come back to this project in the future, this things would definitely need to be taken into account before using it anywhere of importance.
If you really want to see our code, you can find it linked on our devpost or directly on GitHub.
the experience
Besides building the project, we had a lot of fun at TreeHacks! We visited a TON of cool sponsors, and even got to pet some cute llamas and bunnies!
obligatory llama photo

and bunny!
I’ve got to say, before the hackathon I wasn’t really looking forward to building a project. But working with an amazing teammate, and just exploring all that the hackathon had to offer together made it so much more enjoyable.
concluding remarks
TreeHacks was really fun and was really well-run as well. I got to do so many cool things, and see so many interesting projects! Thanks especially to Elastic for choosing us for their sponsor award, and to the TreeHacks organizers for putting on this huge event. We honestly didn’t expect to win anything (especially after spending the whole first day figuring out what in the world we wanted to build…), so this was the cherry on top of a fun weekend. I hope to come back next year and build more cool things!
This post is a little bit different from what I usually do. If you’re new here, you should check out my other blog posts about various security topics!